Spectral Quality
Up to this point, we’ve been operating under the assumption that all spectra are created equal. Unfortunately, mass spectrometry is a little more complicated than that.
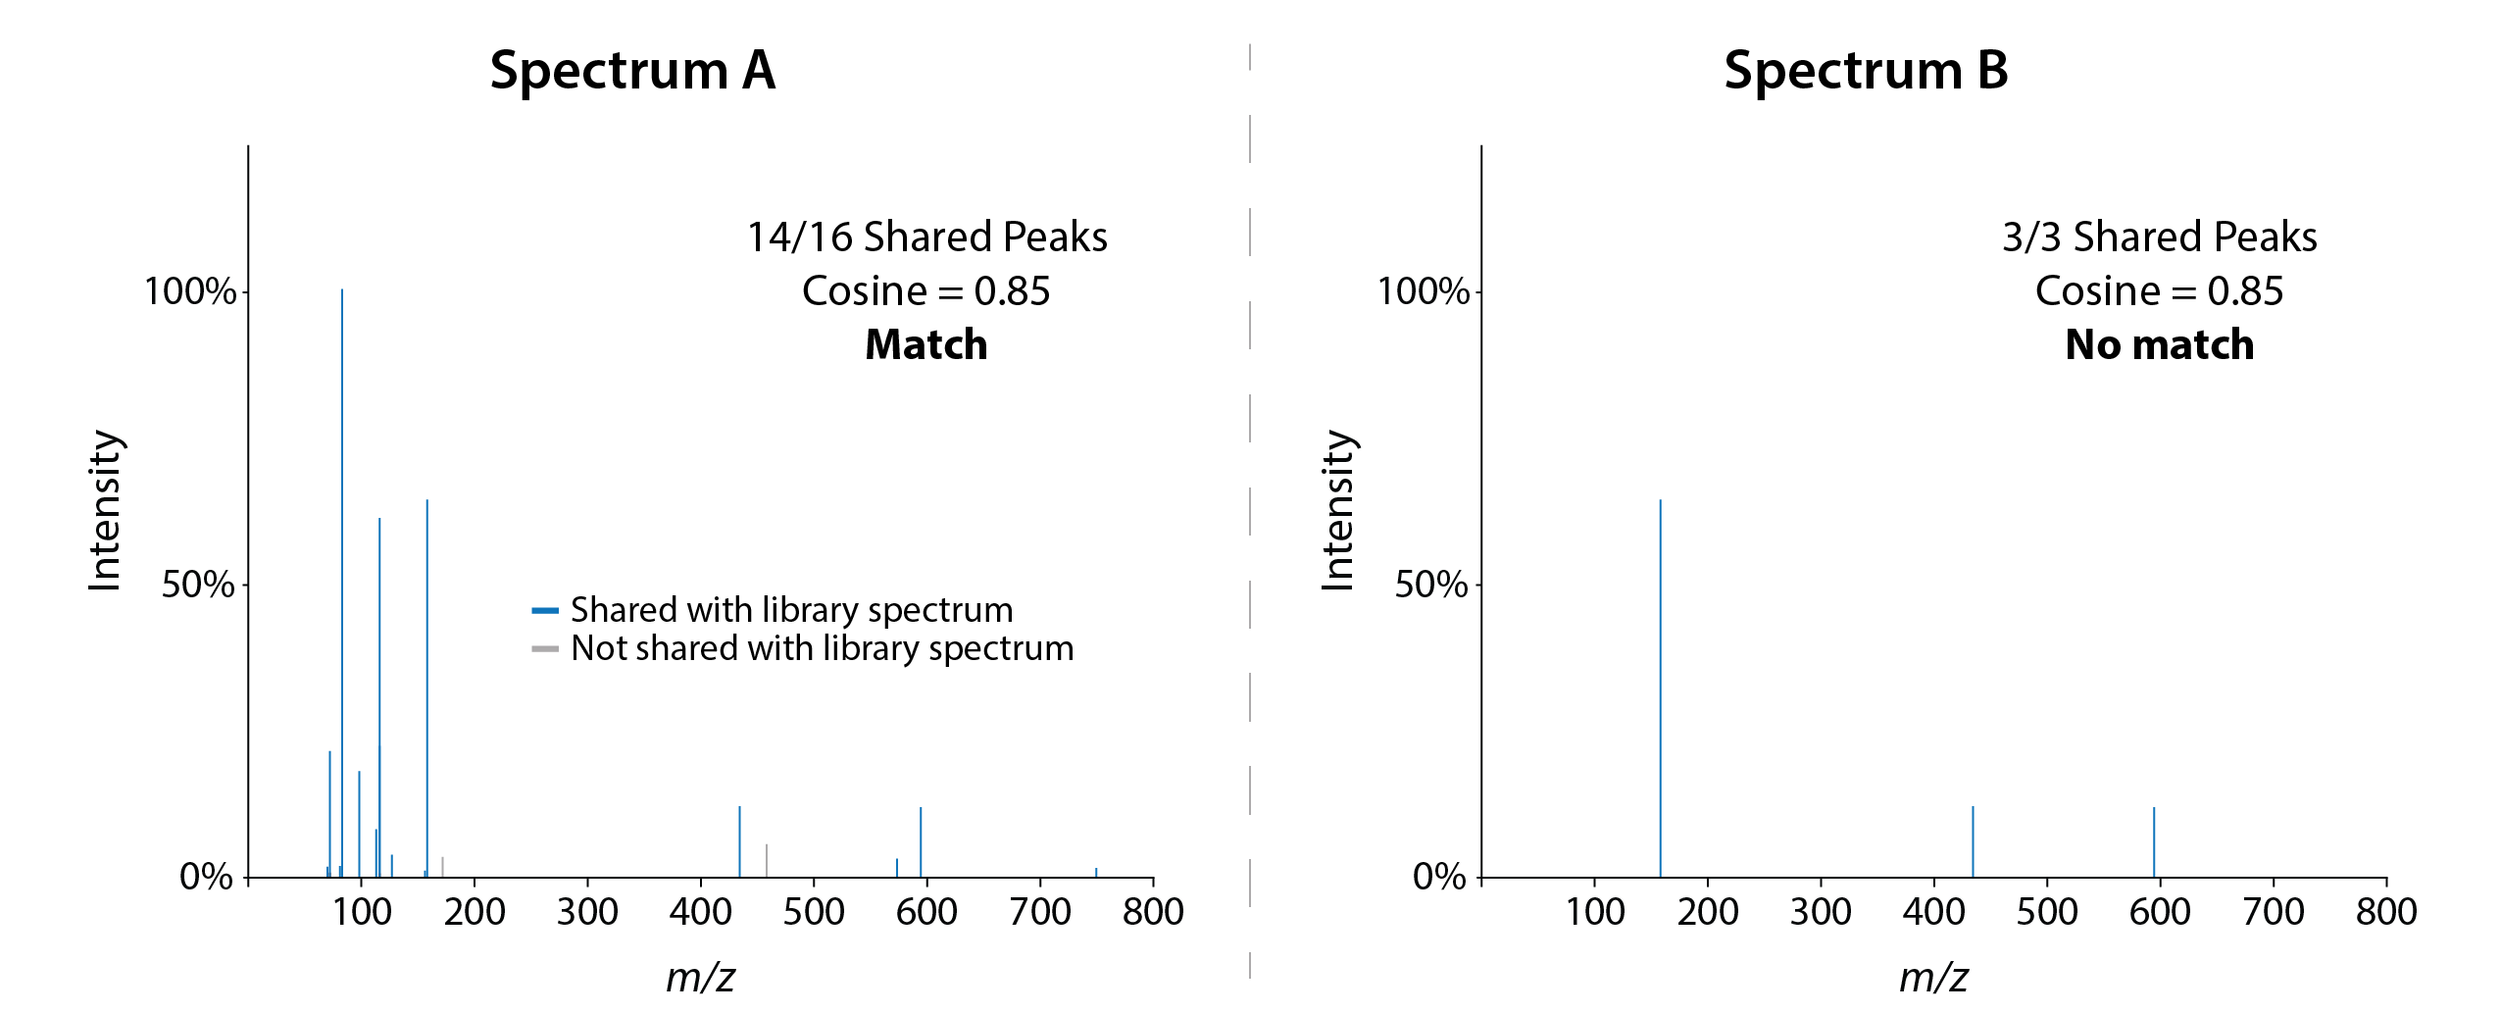
Let’s take a look at two spectra corresponding to the same molecule:
Two MS2 spectrum from the antibiotic azithromycin. Reminder: cosine scores use both shared peaks and peak intensity to calculate similarity.
As you can see, while both spectra are accurate, Spectrum A provides a lot more information than Spectrum B. That extra information can prove crucial when performing metabolite annotation. Most library matching algorithms require a certain number of shared MS2 peaks to match an experimental spectrum to a library spectrum. For example, by default Ometa Flow only considers library matches with a minimum of 6 shared peaks. If your MS2 spectrum only has 3 peaks, it won’t be annotated.
Great! More peaks = better spectra! Unfortunately, it’s still more complicated than that.
The problem is that not all peaks in a spectrum are useful. Some are noise. Noise refers to peaks created by stray electrical signals or contaminants that have nothing to do with the mass of your analytes. All mass spectrometers measure a certain amount of noise, but you can often reduce noise levels by optimizing instrument parameters or giving your mass spectrometer a good spring cleaning.
To get an idea of how noise can affect spectral quality, let’s take a look at two new spectra:
If we were just counting peaks, Spectrum C is the clear winner. However, the majority of those peaks are noise, meaning they tell you nothing about the structure of the metabolite. Again, this makes a difference when you’re doing something like library matching or molecular networking. These algorithms annotate/cluster your molecules by looking at the number of shared peaks. Spectrum C might share 100% of its real peaks with the library spectrum for azithromycin, but it’s only sharing 25% of its total peaks. Worse yet, those noise peaks could match to the wrong library spectrum.
The good news is that you can often remove noise after your data has been collected. The most common way is to set a cutoff intensity and only keep peaks that are above that threshold. Here’s how that kind of filtering would affect Spectrum C:
If you’re planning to run a large (or small) experiment, ALWAYS check your spectral quality after the first few runs. Poor spectral quality can often be remedied by fine-tuning instrument parameters, and it’s always worth a couple hours of troubleshooting to get this right. There’s nothing sadder than putting all the effort into collecting, prepping, and running thousands of samples only to find out that your data is ultimately worthless.
If you want to learn more on how to optimize instrument parameters to improve spectral quality, check out the publications below.
In the end, spectral quality is influenced by a variety of factors, including sample handling, instrumentation, and settings. Here are some of the main things you should consider when assessing spectral quality:
Mass accuracy: different mass spectrometers measure mass with different accuracies. Mass accuracies can also differ between MS1 and MS2 data. For example, low-resolution instruments have an accuracy around 2 Da for MS1 data and 0.5 Da for MS2 data, while modern high-resolution instruments have an accuracy of 0.05 Da or below for both MS1 and MS2.*
Signal to noise ratio (SNR or S/N): ideally, real peaks (or signal) in your spectrum will have higher peak intensities than your noise peaks. S/N measures this ratio. You want your S/N to be as high as possible. If S/N is low, it can be difficult to set a noise filtering threshold that removes noise without removing most of your real peaks as well.
Number of peaks: the most accurate, noise-free peaks mean nothing if you don’t have enough of them.
Metabolite degradation: if you’re interested in measuring a specific metabolite, spot check the spectral quality of that metabolite throughout your run. Many metabolites are unstable, and degradation can significantly reduce a metabolite’s spectral quality over the course of your experiment.
Ometa Flow offers a noise assessment workflow that helps you to set appropriate noise filtering thresholds for your data, and also provides options to filter noise from spectra within molecular networking. Get in touch if you’d like to learn more.
Finally, if you’re faced with poor quality spectra, be very careful how you analyze that data. In metabolomics, garbage in is garbage out. In the best case, you’ll get no results analyzing this data, and in the worst case, you’ll get the wrong results. No one wants to spend months trying to elucidate the structure of the hottest new biomarker only to find out that they were chasing noise the whole time. In most cases, it’s much better to re-run samples with better spectral quality than to spend your time sifting through trash.
*Da = dalton. A dalton is 1/12 the weight of carbon-12, so it’s essentially the weight of a proton or neutron. This means that high-resolution instruments can measure mass down to 1/20th the weight of a single proton (crazy!), but it also means that low-resolution instruments can be off by the weight of a couple of protons/neutrons. That’s the difference between a carbon and nitrogen atom, so keep that in mind if you’re analyzing this type of data.
Want to learn more?
Defossez., et. al. Eight key rules for successful data-dependent acquisition in mass spectrometry-based metabolomics. Mass Spectrom. Rev. 42, 131–143 (2023).
Stincone, P et. al. Evaluation of Data-Dependent MS/MS Acquisition Parameters for Non-Targeted Metabolomics and Molecular Networking of Environmental Samples: Focus on the Q Exactive Platform. Anal. Chem. 95, 12673–12682 (2023).
Have more questions? Contact us.


